Promotional Features

How automation has changed the way we count cells
Measuring cell concentration is the main reason for scientists to be in the lab in the weekend
There was a time when scientists had to pass by their lab during weekends. They had to break off personal activities to monitor cell proliferation and viability in the laboratory. Automation has changed this way of working and the scientistsdo not need to come to the lab in the middle of the night orat thein their weekends.
When cultivating cells in bioreactors we want to know cell concentration and cell viability. These parameters are a measure for the status of the culture and are the basis for calculating derived parameters; for instance specific production and consumption rates or volumetric productivity of a process. Another important reason for measuring cell count and cell viability is the documentation of the process according to European Medicines Agency (EMEA) and U.S. Food and Drug Administration (FDA) regulations.
Manual cell counting
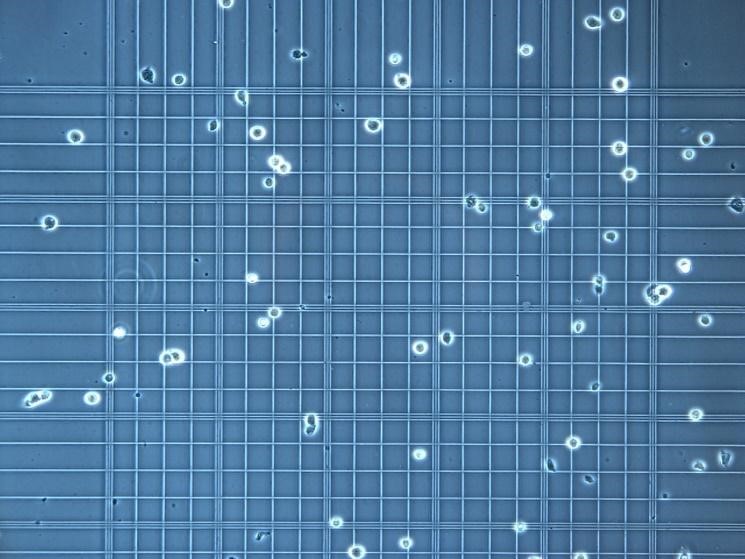
Today dye exclusion is the standard method for monitoring and documenting cell concentrations and cell viability using a hemocytometer. Different hemocytometers are available., tThe most basic and most widely used cell counting method is the Neubauer chamber. Alternative hemocytometers are the Fuchs-Rosenthal or Makler and Horwell chambers., tThese all differ in the depth and shape of the chambers. Counting cells using thetTryptanBblue dye method using a hemocytometer,resultsin subjective cell counts mainly depending on the judgement of the operator. This results in low precision and poor accuracy due to the limited number of cells that are counted.
Automated cell counting
The next step up in cell counting is automation using coulter counter systems or flow cytometry-based counters. These systems rely on counting the number of specific size particles through electrical or optical detection. These technologies however do not have a specific separation point for dead or viable cells, so the analysis results are still open to operator interpretation.
Another method of automated cell counting is provided by camera image recognition of samples prepared usingtTryptanBnlue dye staining method. Examples of these instruments are Cedex, Vi-cCell and theNexcelomNexelomsystems. All these systems provide a more accurate and more precise cell count duetothe larger number of cells that can be counted and there is no operator judgement involved. These systems are currently widely accepted as the “gold standard” for cell-counting methods. There are however some disadvantages with these systems as well; since these systems are mainly used off-line, bioreactor sampling has to be done manually meaning that the operator still needs to come to the lab to perform the analysis (including at night and during the weekend). The sample volume per analysis is significant which could be a problem in smaller scale R&D size bioreactor systems.,aAlso,the sample staining withTtryptanBblue generates toxic waste that has to be disposed of in a safe manner.
A next level is automation of sampling in combination with automated cell counting devices. Several solutions for automated sampling exist, but all of them require significant investments and most of them rely on a mechanical movement for taking samples, which generally results in an additional (high) maintenance demand. The mechanical sampling movement can also introduce another risk to the culture; contamination or cross contamination when samples are taken from multiple bioreactors.
These systems again offer accurate cell counts, but the big advantage is in the automation of sampling; this allows the samples to be taken at the most critical moments in a bioprocess, rather than the most convenient times for an operator. Subsequently these fully automated systems will result in more and better timed analysis results, but the toxic waste and the large sample volume are still a drawbackof these systems.
Online cell counting
The ultimate solution for measuring cell count and viability is an automated online measurement which requires no direct operator involvement, introduces no contamination risk, consumes no sample, generates no (toxic) waste andgeneratesdatais generatedcontinuously.
There are several continuous online biomass determination methods available.;tThe simplest method is an optical density (OD) probe in the bioreactor,,tThese systems estimate the biomass concentration based on the absorption or reflection of light. The result is a biomass concentration value, based unfortunately not only on living cells but also dead cells and cell debris,.vViability is not measured.
A better alternative is capacitance measurement;. tThis measures the total membrane surface of living cells in the culture using dielectric spectroscopy., tThise membrane surface in the culture is a measure for the number of viable cells. DAdvantage of the measurement that dead cells and cell debris do not contribute to the measurement, but this is also a disadvantage as the total cell count is not measured, so viability is not determined. Also due to the nature of the measurement, when the cell size (and membrane surface) changes, the measurement of viable cell count changes as well. This means that the calibration of such a system needs insight into the cell’s life-cycle and morphology before a reliable measurement can be done.
The Ovizio iLine F isa recentthe latestdevelopmention automated cell counting and viability measurement. It offers a label free, non-invasive, quantitative cell analysis using 3Ddholographic image analysis cells. The image analysis is label free; no cell-staining is needed and no toxic waste is generated. Cells are pumped from the bioreactor, analyzed and are returned to the bioreactor. This means no sample volume is consumed, allowing this technology to be used for very small R&D bioreactors as well.
The Differential Digital Holographic Microscopy (DDHM) of the iLine F is a new quantitative imaging technique that allows continuous cell counting as well as cell viability monitoring in a label-free set-up. No need for sampling (eliminating contamination risk), staining the sample and waiting for the results generated by an off-line counter: your results are generated continuously and are available during the whole run.
The operator can track the total cell density (TCD) plus the cell viability (VCD) at any time, while the software OsOne plots the cell growth curve live on the screen. Moreover, the software can also show real images of the cells, offering any experienced operator a particularly convenient tool to check the condition of his cell culture: “Seeing is believing”.
IndDigitalhHolography, the scattered light beam from an illuminated object interferes with a reference beam on acharge-coupled deviceCCDcamera allowing for a 3D numerical reconstruction of the illuminated object. The iLine F’s DDHM is an evolution of this base technology that enables the use of a partial coherent light (low power, non-invasive LED light)and results in an improved image quality as well as an important size reduction of the instruments.
Discriminating living from dead cells is based on their ‘holographic fingerprint’: when illuminated, healthy cells focus light and create ‘light cones’, while dead cells show scattered, less intense focaliszation peaks. To make the distinction between living and dead cells, other parameters are also taken into account (eg. cell diameter, cell roundness, cell volume).
OsOne plots the results graphically on the screen, in real-time and during the complete run. With the growth curves (Figure 4a) the different phases of the culture (from the lag phase to the death phase) can be easily monitored, enabling for example anticipation of feeding or harvesting times. The iLine F in combination with the OsOne software is a sample and label-free cell quantification method that has been found to be as reliable as the current reference methods applying tTrypan-Bblue staining.
Indeed, continuous measurements via OsOne matches the time-point results obtained by the Vi-Cell (an off-line counter usingtTrypan blue from Beckman Coulter) as well as with manual counting. The representation of the Viable Cell Density (VCD) measured with OsOne versus from the Vi-Cell shows a good correlation. Similar results have been obtained for the Total Cell Density (TCD) and the viability over time, and independent sources have confirmed results versus the Cedex (Roche) and the CASY (Innovatis, data from Prof. Gudermann, TU Bielefeld).
The iLine F in-line technology combined with the powerful analysis software OsOne delivers equivalent results compared to the reference methods. Moreover, it offers the advantages of a continuous, sample-free measurement, avoiding the use of cell dyes. It also paves the way for further automation for control of your bioprocess, for example through a link via the bioreactor controllers, or even through its integration in analysis software such as the Lucullus Process Information Management System.
a) Over time: Viability, Total Cell Density and Viable Cell Density are measured during the complete run.
b) Time point: Data can also be represented for a selected time point: this is a bar chart representing the cell population repartition according to the diameter and statistic data such as average, minimum and maximum.